
“Readiness” has become a word every training vendor uses. A claim you can’t see is just marketing. So here is exactly what our Workforce Readiness Score measures, how the signals combine, and what the numbers mean. If a vendor tells you they measure readiness, ask them for a definition page like this.
The problem with the metrics you have today
Completion rates measure attendance. Quiz scores measure recall on the day of the quiz. Role-play session scores measure one conversation. Each is a real signal — and each answers a different, narrower question than the one you actually have: is this person ready to perform?
The Workforce Readiness Score exists because that question needs one answer, not forty scattered tiles.
What goes into the Score
The Score combines three families of signal from every training touchpoint in REACHUM:
1. Assessment — what they know
Results from quizzes and knowledge checks across lessons. Not just pass/fail: which topics, how recently, and how consistently. Assessment that hasn’t been checked in months decays in the Score, because it decays in real life too.
2. Practice — what they can do
Results from practice, not recall: AI voice role-play conversations, labeled diagram exercises, interactive hotspot tasks. A rep who can recite the label but freezes on an objection scores differently from one who handles the conversation. This is the signal completion metrics never reveal.
3. Engagement — whether the signal is current
Recency and consistency of activity. A high score from six months ago is not a high score today. Engagement doesn’t inflate the Score — it keeps it honest, flagging when assessment and practice signals have gone stale.
How the signals combine
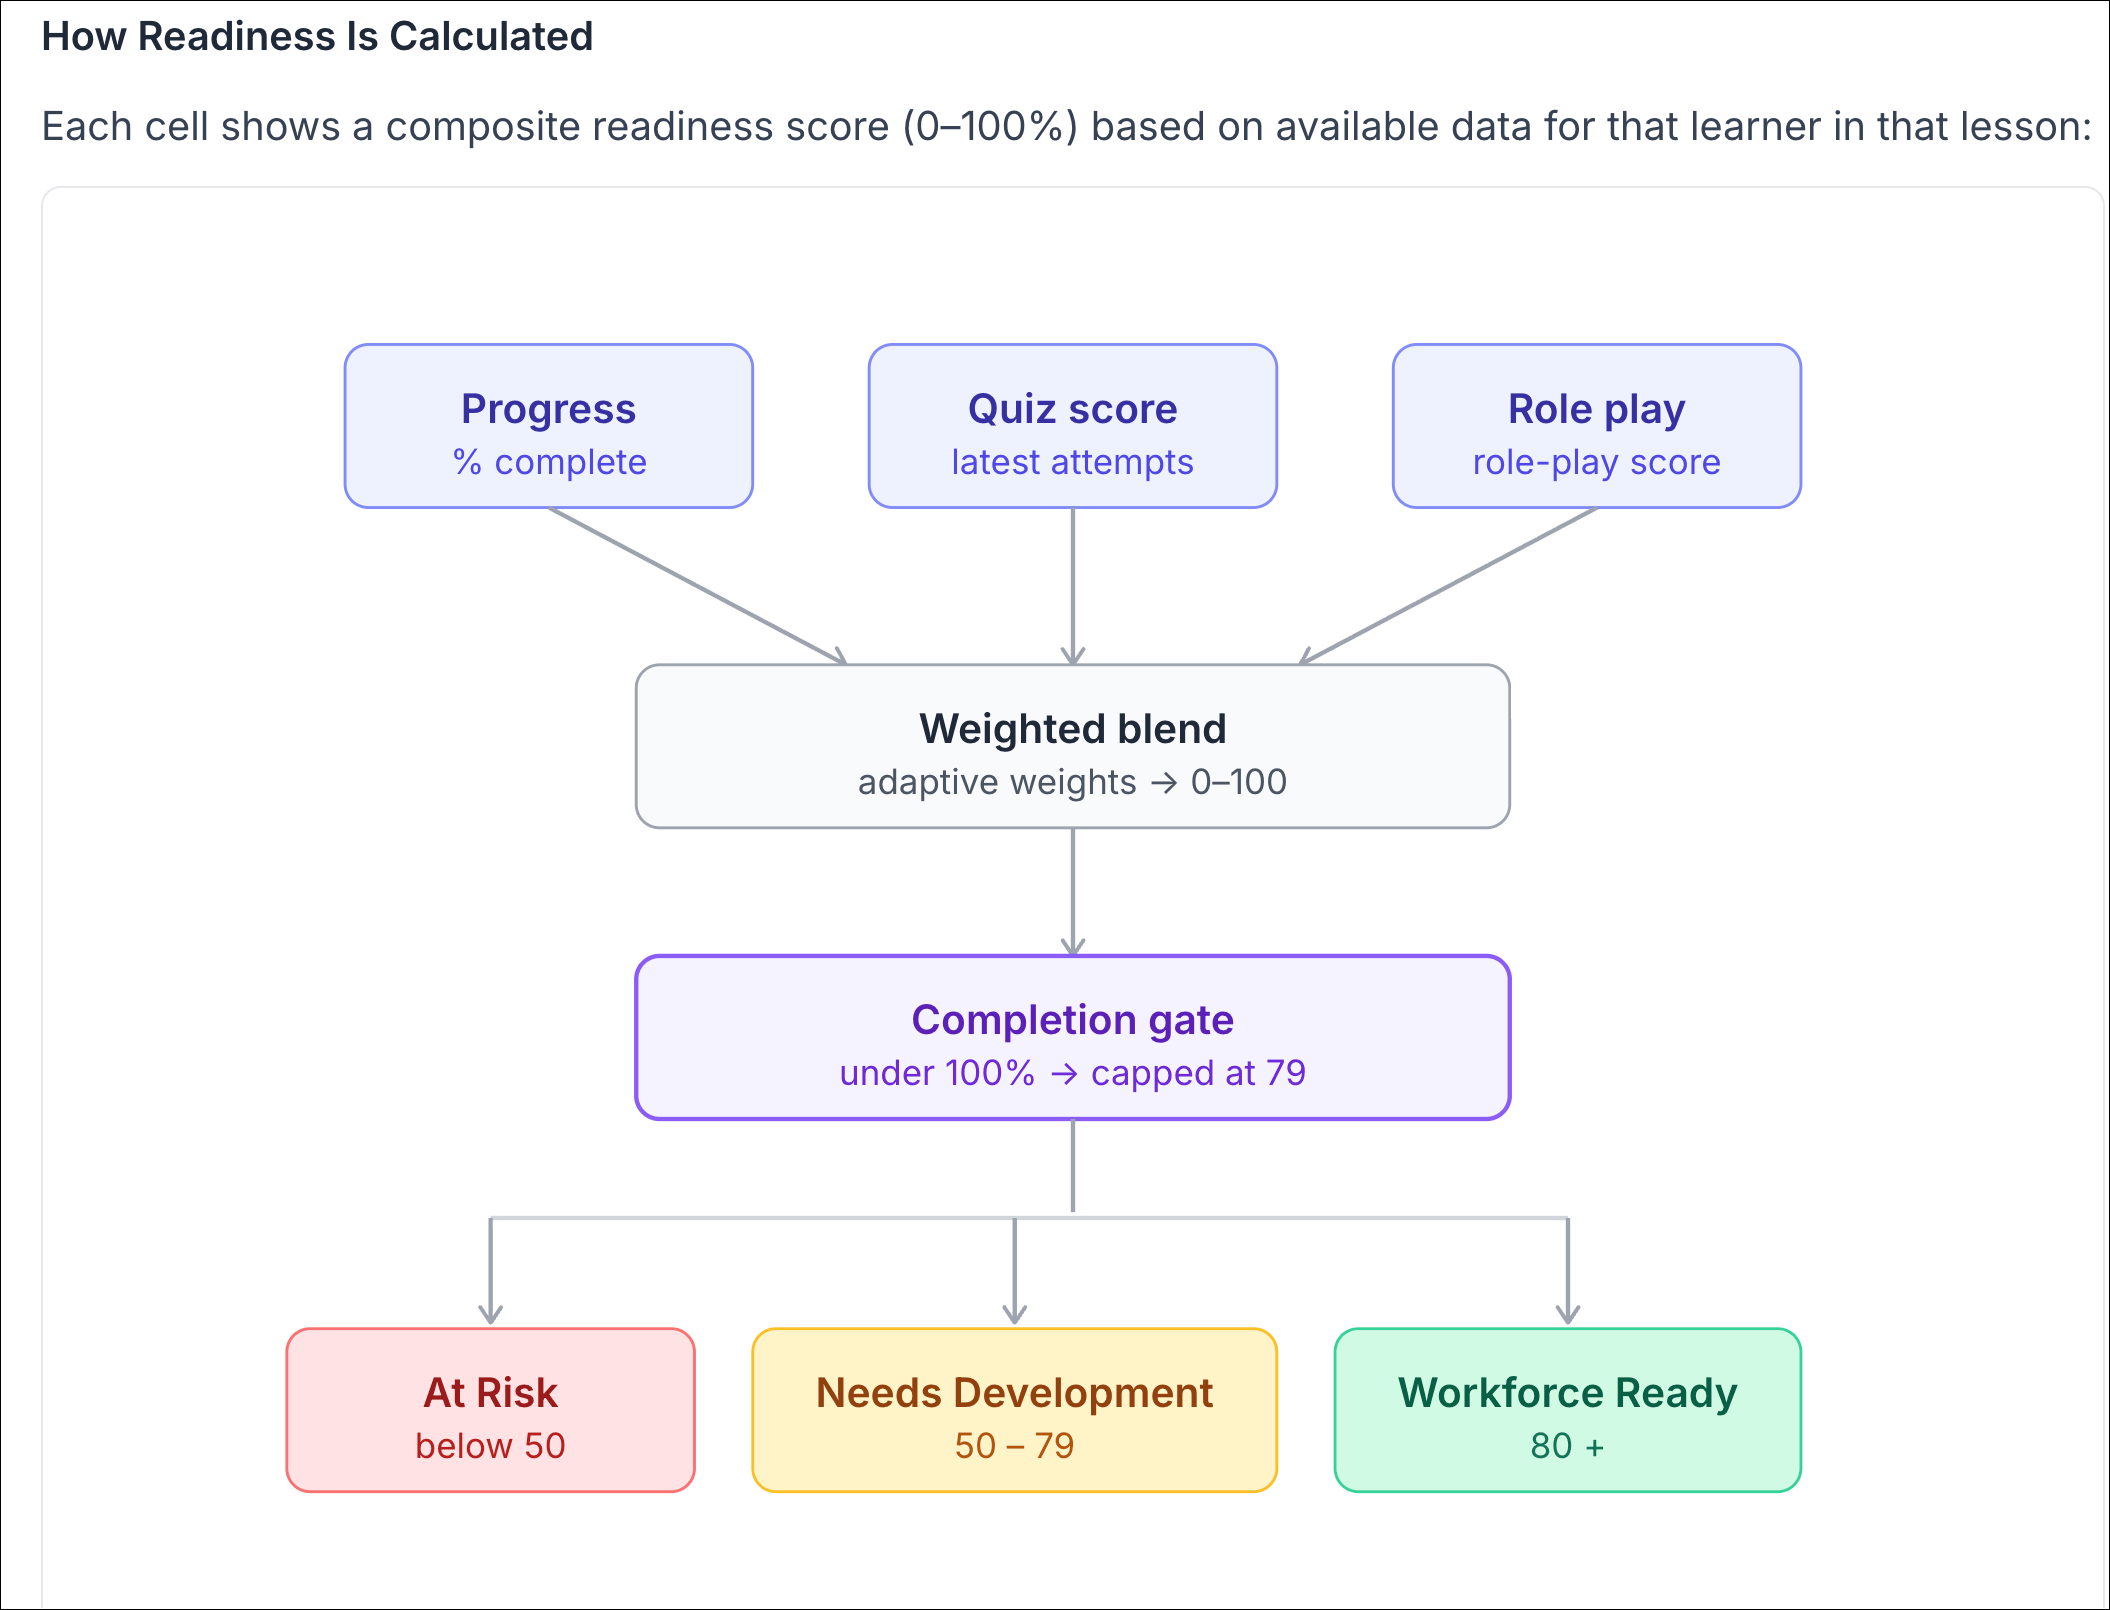
Each learner’s Score is a weighted composite of the three signal families, normalized to a 0–100 scale and updated live as new activity lands — not batch-recalculated at month end. Team, department, and initiative scores roll up from individual scores, so a VP’s launch-readiness number and a manager’s coaching view are the same math at different zoom levels.
How we weight the signals: Practice is weighted most heavily — doing beats knowing. Assessment decays with time since the last check. Engagement acts as a freshness multiplier: it never inflates a weak score, it only keeps the number honest when activity goes quiet.
Why completion is a gate, not a score
Completion earns a learner nothing. It only removes a ceiling.
An incomplete learner is capped at 79 — however well they are performing — because completion is a boolean. "Ten seconds from done" and "done" look identical to it. If ninety-nine of a hundred people are moments from finishing, an ungated score would report that cohort as ready when not one of them has finished anything.
So completion does not prove readiness. It simply stops an unfinished cohort from reporting as ready. That is why the Score treats it as a gate rather than an input.
What the number means
- A score is a snapshot, not a verdict. It answers “ready now?”, and it changes as people practice, learn, and lapse.
- Thresholds are yours to set. A pharma field launch and a hospitality onboarding have different bars. REACHUM shows the number; your team decides what “ready” requires.
- The Score is diagnostic, not just evaluative. Every team score drills down to individuals; every individual score drills down to assessment, practice, and engagement — so a low number always comes with a reason and a next action.
What the Score is not
- It is not a completion rate with a new name. Completion moves the Score by exactly zero points — it only lifts the 79 ceiling. Demonstrated assessment and practice are what build the number.
- It is not a quiz average. Recall is one input. Practice is weighted alongside it.
- It is not a black box. This page exists so you can interrogate the model — and so can your compliance team.
FAQ
Is the Workforce Readiness Score comparable across teams?
Yes — same 0–100 scale, same signal families. But content difficulty varies, so the most meaningful comparisons are within a team over time and against your own thresholds.
Can we export the underlying data?
Yes — the underlying learner analytics that power the Score are available for inspection and export. The Score is built from data you can see, not a number handed down from a model you can’t examine.
Have a vendor claiming they measure readiness? Send them this page and ask for theirs.