Analytics & Insights
From Completions to Readiness Proof
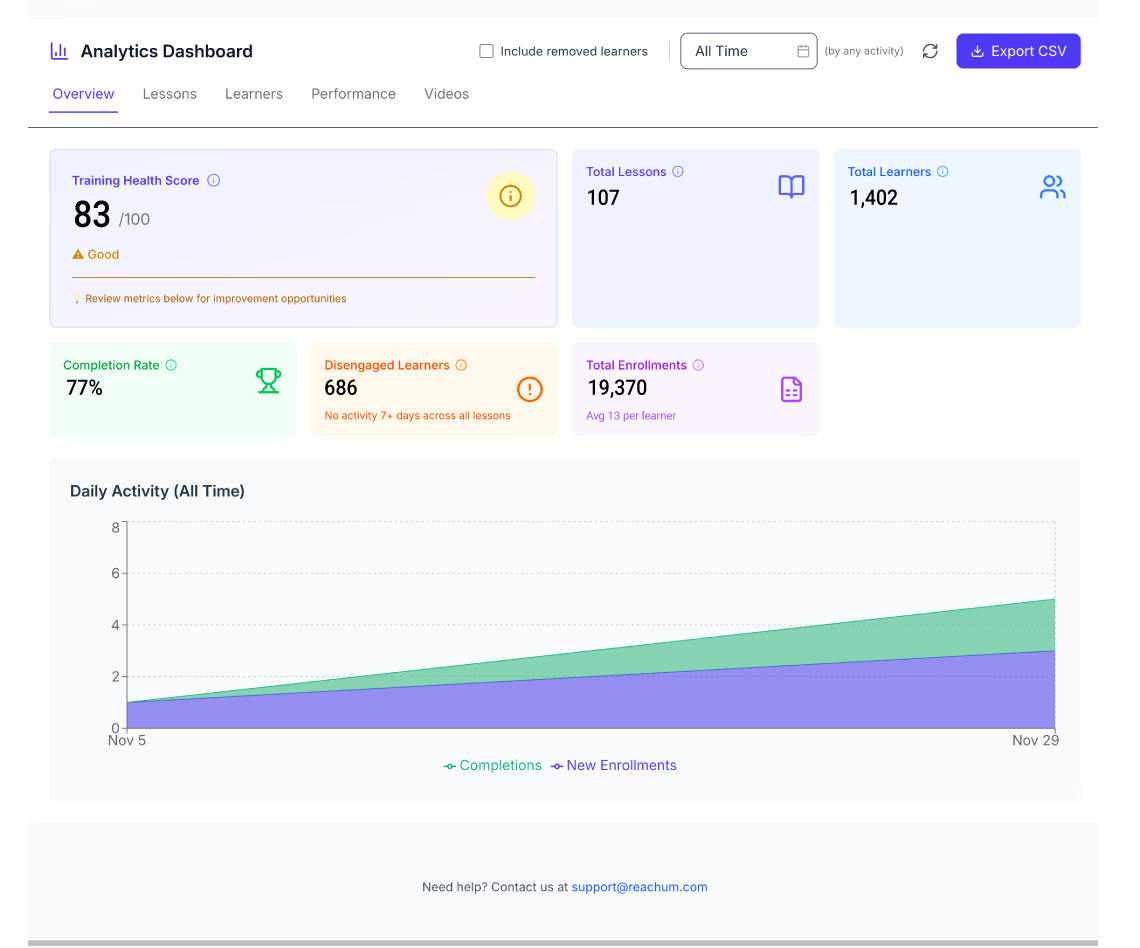
Traditional platforms tell you who finished. REACHUM shows you who's ready — health scores, completion, at-risk alerts, and engagement on one screen, in real time.
Traditional platforms tell you who finished. REACHUM shows you who's ready — health scores, completion, at-risk alerts, and engagement on one screen, in real time.
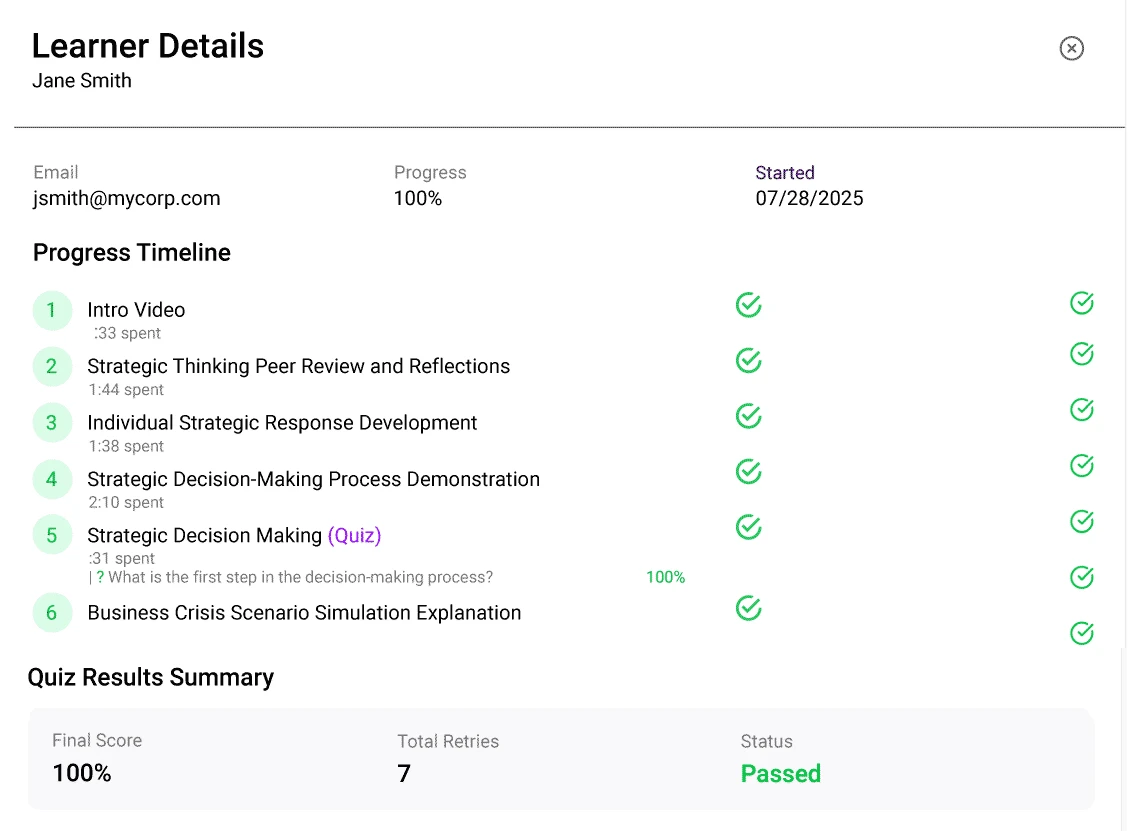
For every learner: a timeline of every page visited, time spent, quiz and activity scores, return visits, and certification status. Not whether someone completed a lesson — how they moved through every element of it, so you can reinforce before a gap becomes a performance problem.
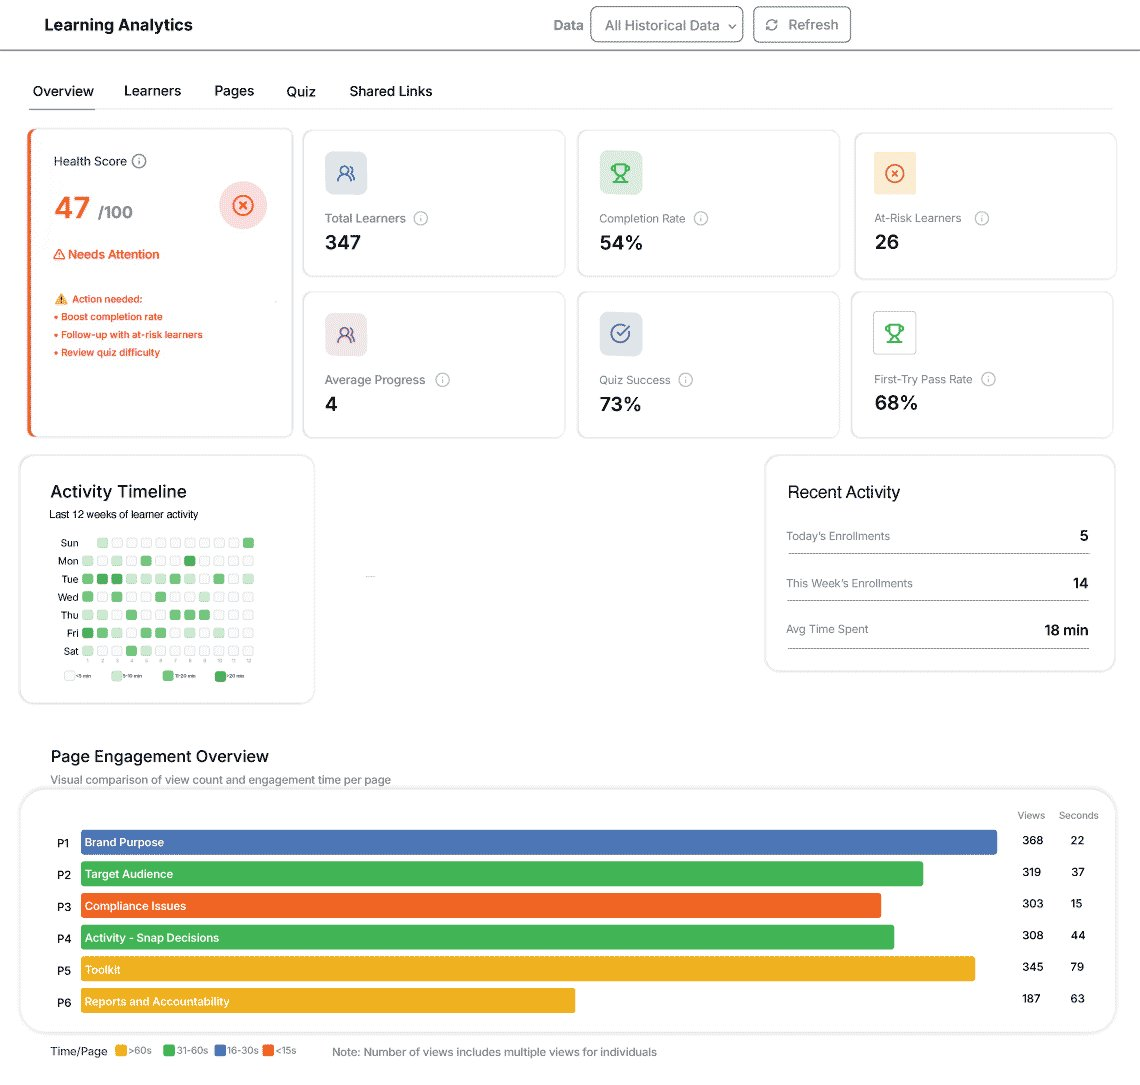
Roll individual data up to the group level and the patterns surface: one region outpacing another, a department stuck on the same concept, a new-hire cohort moving faster than expected. Sort and filter by group, date, or status — operational intelligence, not a spreadsheet you have to dig through.
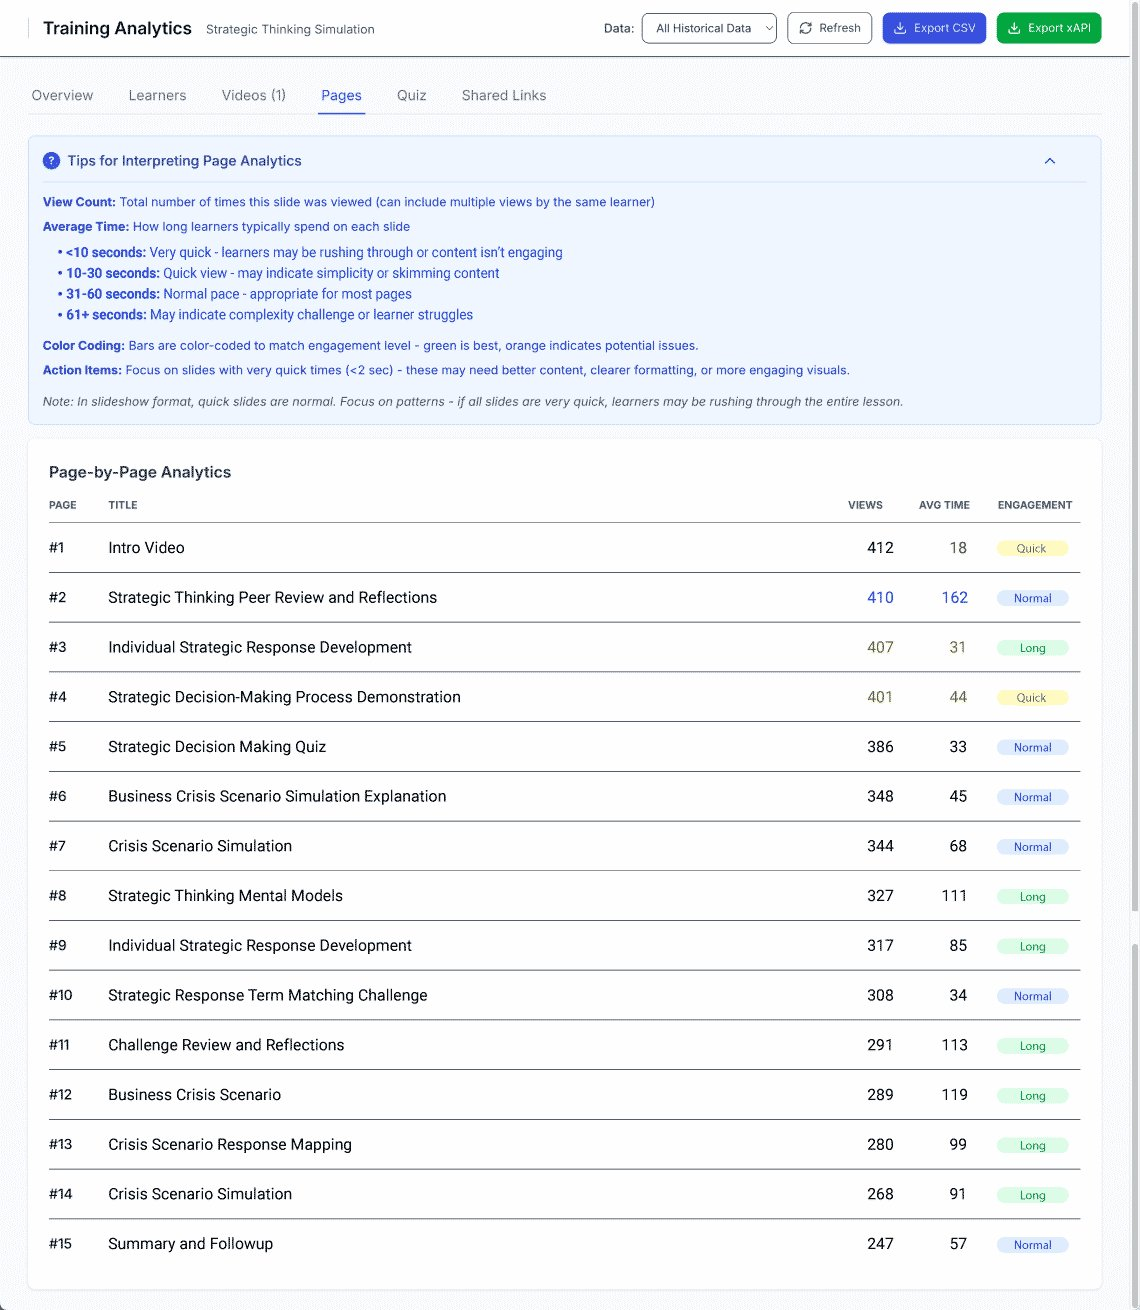
Which pages hold attention, which get skipped, and where time spent means engagement versus confusion. Page-level view counts, dwell time, and engagement ratings tell you how your content is performing — so you can refine the lessons that aren't landing instead of guessing.
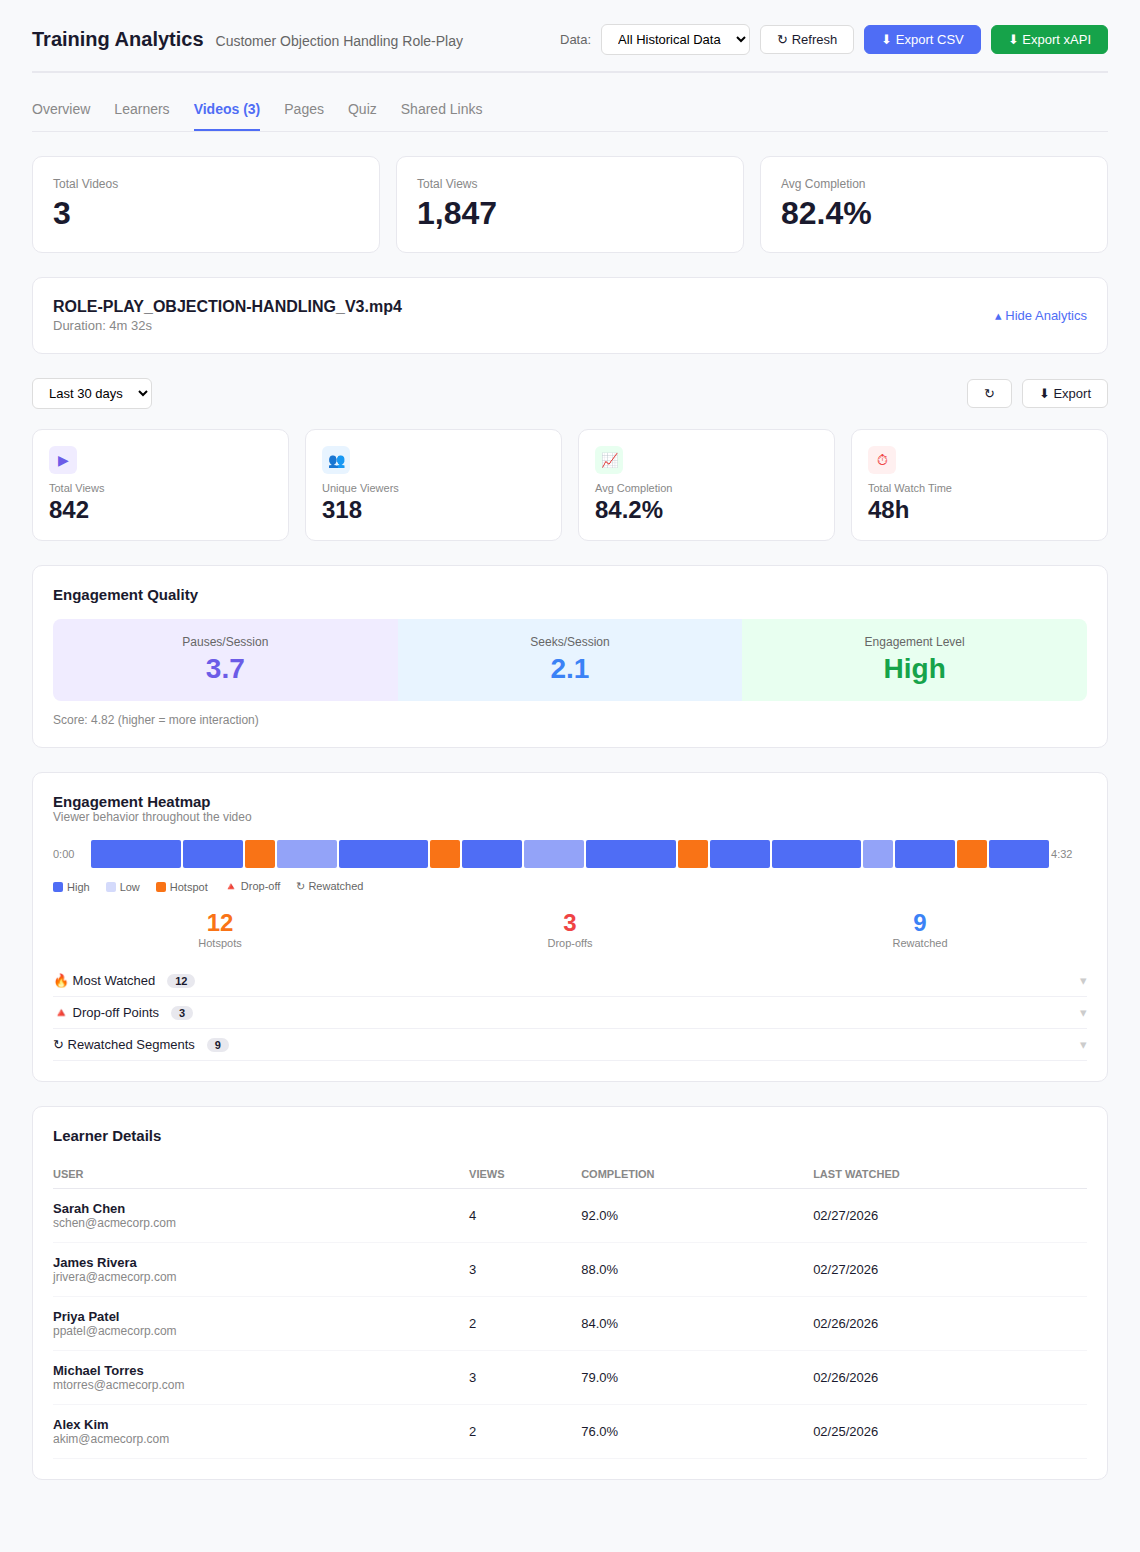
For video and role-play: engagement heatmaps, pause and rewatch patterns, completion rates, and per-learner behavior down to the second. It's the difference between knowing a video ended and knowing what it taught. Go deeper on the video heatmap.
When scores cluster below threshold, engagement drops, or a critical module gets skipped, REACHUM flags it in real time — so you intervene while it still matters.
Every report exports to CSV or JSON for your BI, HR, or compliance systems. Your data, portable and structured — no proprietary formats, no lock-in.
Timestamped, tamper-evident records of every learning interaction — started, viewed, scored, certified. When auditors ask for proof, you hand them a behavioral record, not a list of checkmarks.
Try REACHUM free and watch the data appear on the people you actually train. No credit card, no obligation.