Use ← → arrow keys to navigate
From organizational health scores to individual learner timelines — see how REACHUM analytics turn learning activity into decision-grade data.
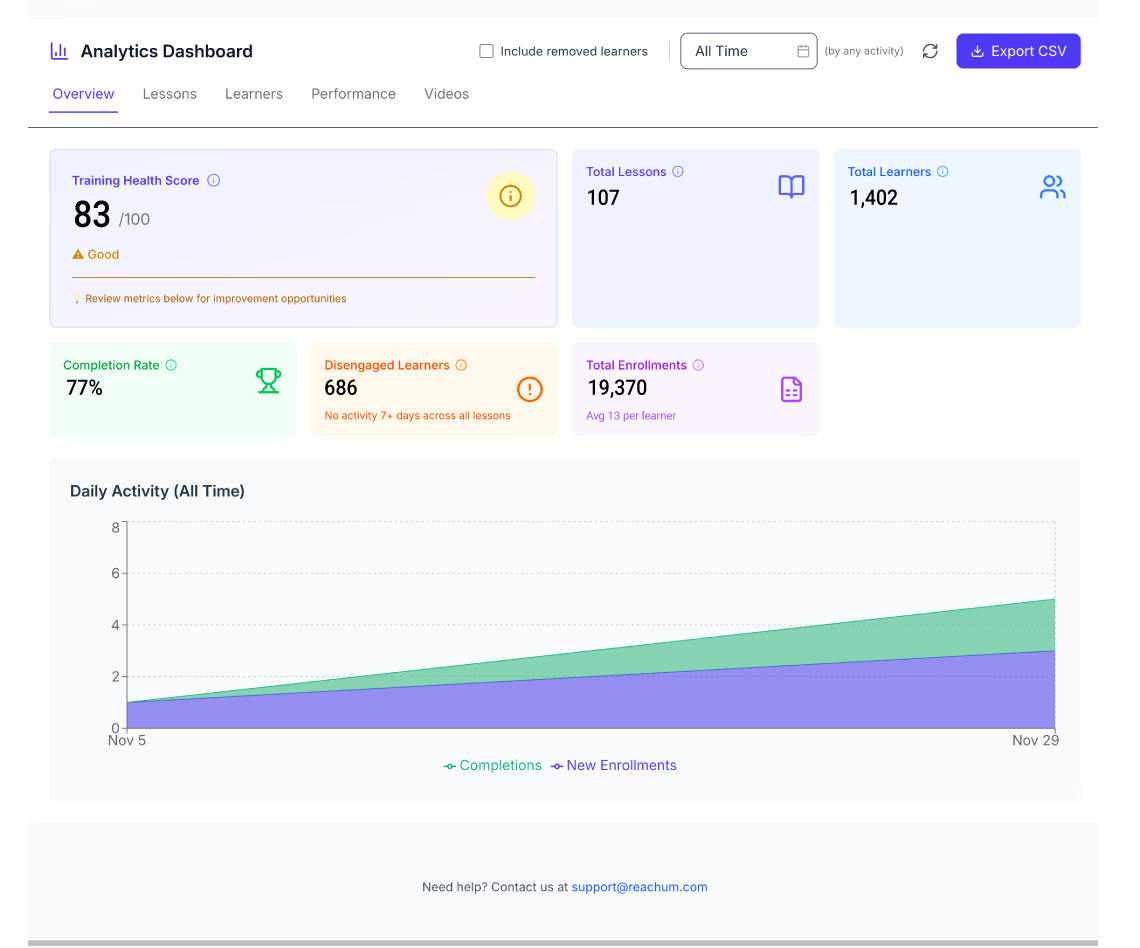
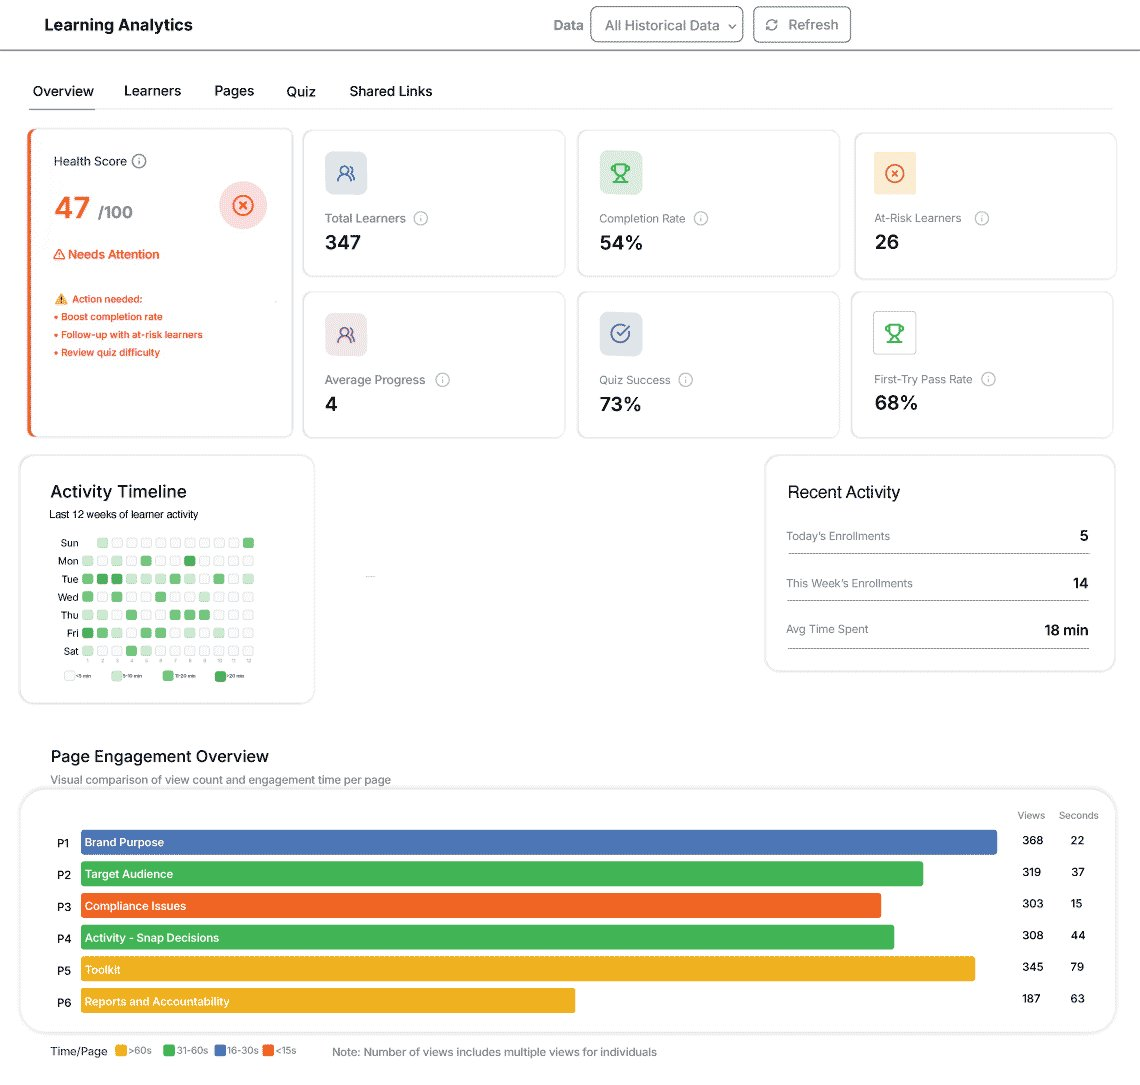
← Back to Analytics & InsightsHealth score, learner count, completion rate, at-risk alerts, activity heatmap, and page engagement — one screen.
Every learner's progress, score, and status in a sortable table. Filter by group, date, or completion status.
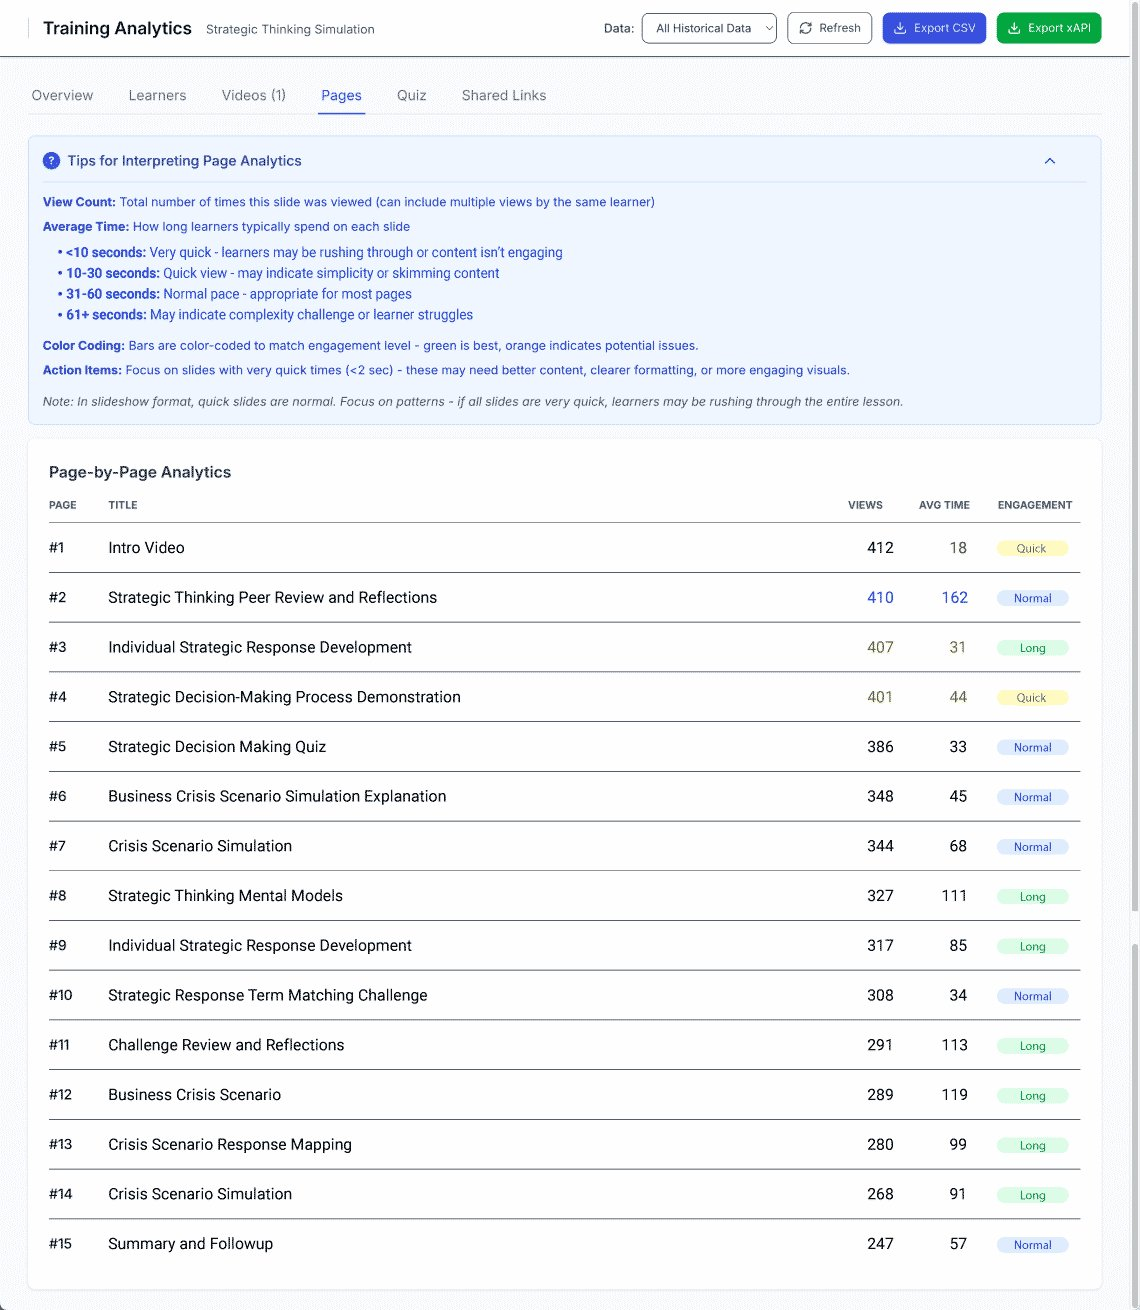
Page-by-page view counts, average dwell time, and engagement level. See which content works and which gets skipped.
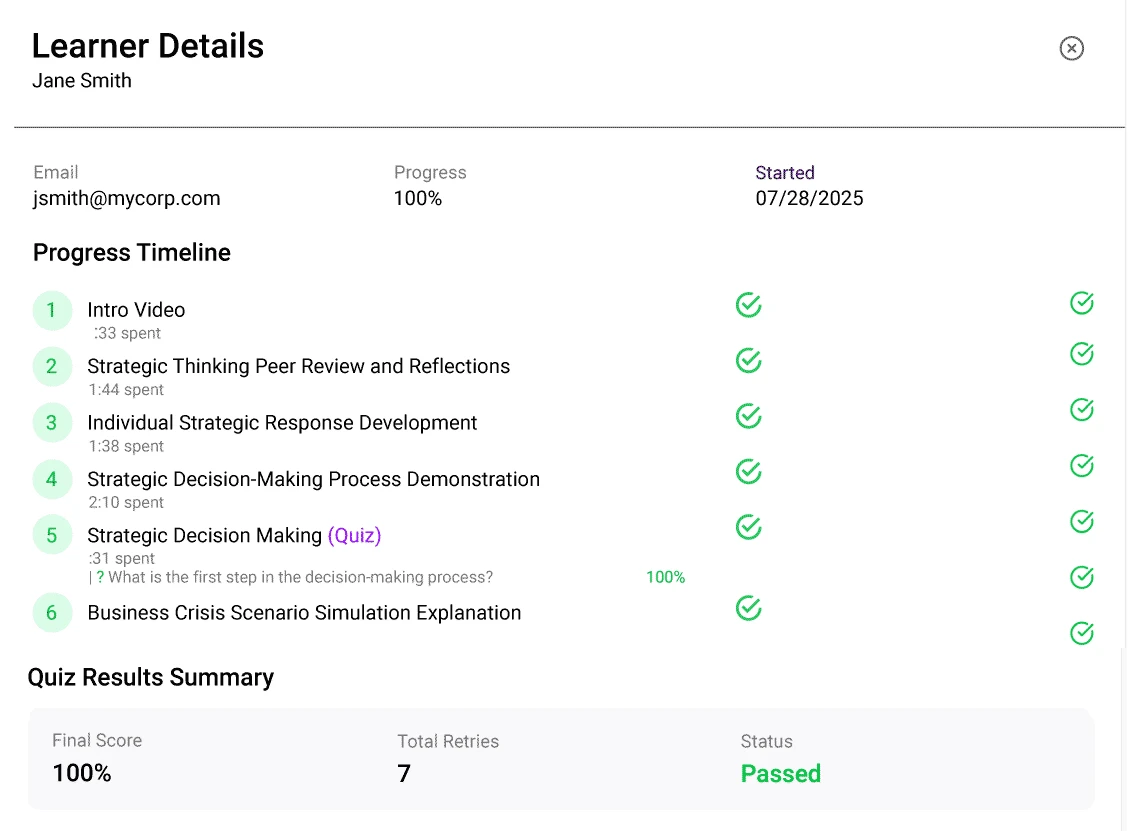
Individual timeline showing every page visited, time spent, quiz results, and certification status.
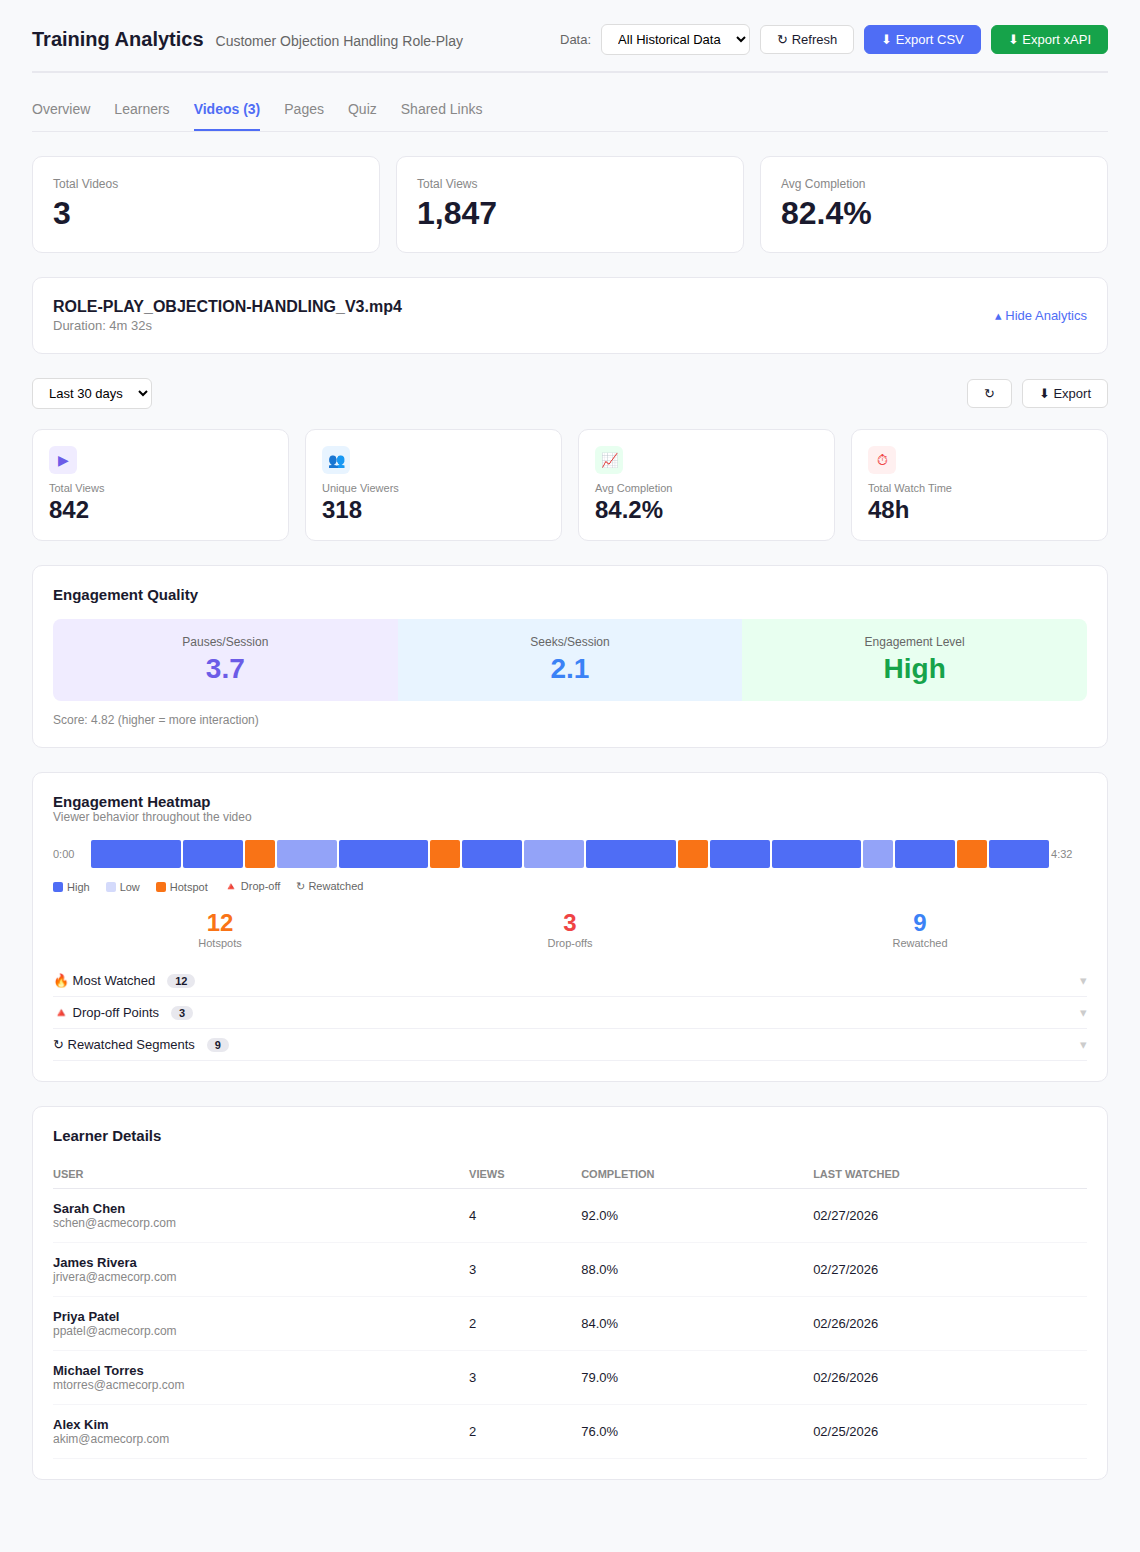
Engagement heatmaps, pause and rewatch patterns, completion rates, and per-learner video behavior.
Try REACHUM free and watch real analytics appear on your own content. No credit card. No obligation.
Get Started Free →